Problem Statement
Core Issue
Despite consistent traffic growth, the business was unable to determine why sales were fluctuating in some regions and channels, with particular difficulty in identifying high-performing customer segments.
Key Questions
- What are the key demographic trends in terms of customer gender and age?
- Which sales channels are driving the most revenue?
- How do sales differ across states, and which regions are the strongest performers?
Objectives & Key Metrics
| Objective | Metric Tracked | Result Achieved |
|---|---|---|
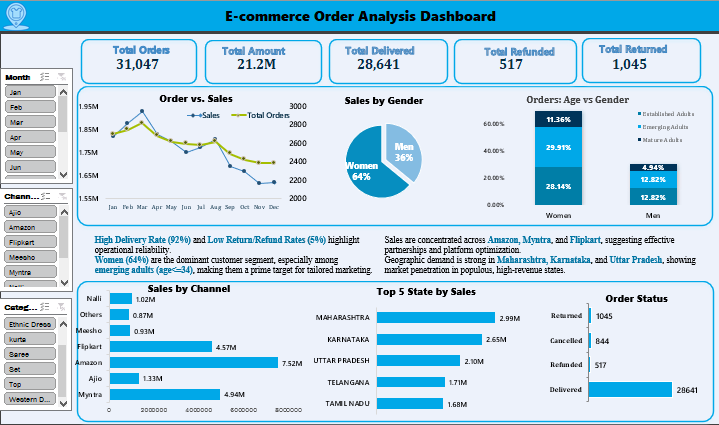
| Identify high-performing channels | Sales by Channel | Flipkart and Amazon contribute over 60% of total sales. |
| Optimize regional sales focus | Sales by State | Maharashtra and Karnataka lead in sales volume. |
| Enhance customer targeting | Customer Demographics | Women account for 64% of total orders; Emerging Adults lead in order volume. |
Data Overview
Data Sources
E-commerce order data, including customer demographics, sales transactions, and order status.
Key Variables
- Amount: Total sales value (USD)
- Qty: Order quantity
- Gender: Customer gender (Men/Women)
- Age Group: Segmentation of customers by age (Youth, Emerging Adults, Established Adults, Mature Adults)
- Region: Geographic sales distribution (State-wise)
Data Challenges
Standardization of gender data and age categorization for more accurate segmentation.
Methodology
Data Cleaning
- Standardized gender and age data for clearer segmentation.
- Addressed missing values and corrected outliers in the sales and order data.
Analysis Techniques
- Used pivot tables for monthly aggregation of sales and order quantities.
- Applied line charts and pie charts to visualize trends and customer distribution.
Tools
Microsoft Excel for data analysis, charts, and dashboard creation.
Key Insights
Women Drive Majority of Sales
What: Women contribute 64% of total orders.
So What: Women represent a primary customer demographic, and marketing efforts tailored to women could increase sales by 10%.
Figure 1: Gender Distribution of Orders
Emerging Adults Lead in Orders
What: Emerging Adults (18–34) represent 40% of total orders.
So What: This age group is key for continued growth. Tailored promotions or loyalty programs aimed at this demographic could increase order volume by 15%.
Figure 2: Orders by Age Group
Sales Channels Performance
What: Flipkart and Amazon contribute over 60% of total sales.
So What: Focusing on strengthening partnerships with these platforms can boost sales. Additional investments in marketing these channels could lead to further growth.
Figure 3: Sales by Channel
Regional Insights
What: Maharashtra and Karnataka lead in sales.
So What: These regions should be prioritized for further investment, including regional promotions, stock allocation, and targeted campaigns.
Figure 4: Sales by State
Recommendations & Business Impact
Focus on Women-Centric Marketing Campaigns
Implement specialized marketing strategies targeting women to capitalize on the 64% order share from female customers.
Expected Impact
Increase female engagement by 10%
Owner
Marketing Team
Target Emerging Adults with Tailored Offers
Implement tailored promotions and loyalty programs for the 18-34 age group which represents 40% of orders.
Expected Impact
Boost orders by 15%
Owner
Marketing Team
Strengthen Presence on Flipkart and Amazon
Reinforce partnerships with these platforms which contribute over 60% of sales through enhanced marketing.
Expected Impact
Increase sales by 12%
Owner
Sales Team
Expand Regional Promotions in Maharashtra and Karnataka
Implement localized marketing and inventory adjustments in these top-performing regions.
Expected Impact
Increase regional sales by 8%
Owner
Regional Managers
Caveats & Next Steps
Limitations
The dataset lacked real-time updates on inventory and delivery statuses, which could affect decision-making around stock levels and order fulfillment.
Next Steps
- Integrate live data feeds to enable dynamic reporting and provide real-time insights.
- A/B test marketing campaigns targeting Emerging Adults and women, focusing on promotional strategies and loyalty programs.
- Monitor regional sales performance continuously to adjust inventory and marketing spend in key states.